Real-time maps show a world at cyber war
Interactive global maps from Norse and Kaspersky depict cyberattacks in progress around the globe. It's not a pretty picture—even if it does look cool.

No shortage of security experts have said that World War III will take place in cyberspace. In fact, some say it’s already happening—U.S. military and civilian agencies see tens of millions of attempted cyberattacks a day, as does industry; the United States carries out its own cyber operations, as do other countries.
If you’ve ever wondered what cyber war looks like, you can get an idea from several interactive, real-time maps that track and depict cyberattacks around the globe.
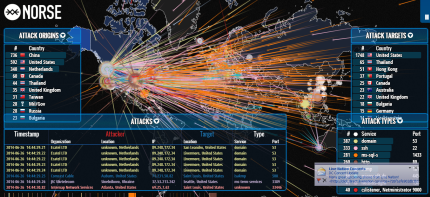
Norse, a St. Louis-based cyber security company, recently unveiled a real-time map showing cyberattacks in action, along with information on attack origins, attack targets and the types of attack vectors being used. You don’t have to watch the map for long before you’ll see that the United States and China are the biggest sources of attacks, and that the United States is the top target.
The data on the attacks is drawn from Norse’s international network of honeypots — decoy systems set up to attract attackers — so the map isn’t showing real attacks. But if the targets aren’t real, the attackers are, and the map does give a pretty good idea of what’s going on in cyberspace in general, if not specific, terms. (On the map, for instance, St. Louis, the company’s home base, seems to be a disproportionately frequent target.)
Attacks seem to ebb and flow, ranging from short periods of occasional volleys to widespread assaults in every direction, as in the image above.

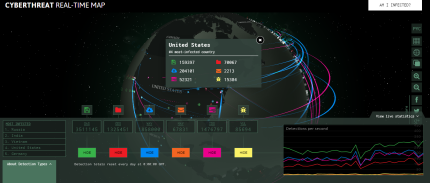
Kasperky Lab offers a different view with its Cyberthreat Real-time Map, which takes a Google Earth-like approach with data drawn from the company’s security network. The map shows a darkened, rotating globe with different types of attacks streaking around the world. Users can rotate the globe on their own, zoom in and out, and click on a country to get attack statistics. Click a tab to get global statistics. If you don’t like the look or having to rotate the globe on your own, you can change the background or convert it to a flat map. As with Norse's map, the rate of attacks covers a wide range.
During a recent session, the United States, the most attacked country by Norse’s count, was only the fourth most infected on Kaspersky’s map. Russia was the most infected, followed by India and Vietnam. China was seventh.
There are some other attack maps as well, such as the Digital Attack Map, which is updated daily to show the previous day’s top distributed denial of service attacks around the world.
The maps are visually appealing, even mesmerizing in a way. But they don’t paint a pretty picture when you consider what they actually represent.
The Defense Department in 2012 said it saw as many at 10 million hacking attempts per day. The Energy Department’s National Nuclear Security Administration reported the same number. Industry, too, is a target. Defense contractors are targeted for intellectual property and military secrets. Wall Street firms, media conglomerates and other companies, from Google to Sony, have suffered from attacks.
The United States, in fact, recently charged five Chinese military officials with cyber espionage, the first time the government has filed those types of charges against state actors.
The data on these maps, of course, isn’t comprehensive and limited to state-sponsored operations. The attacks they show could be from organized crime, script kiddies, unscrupulous businesses or any number of other sources. But at least some of that traffic is state-sponsored in one way or another. And if a major cyber war ever starts (if it hasn’t already), this is what it would look like.


